

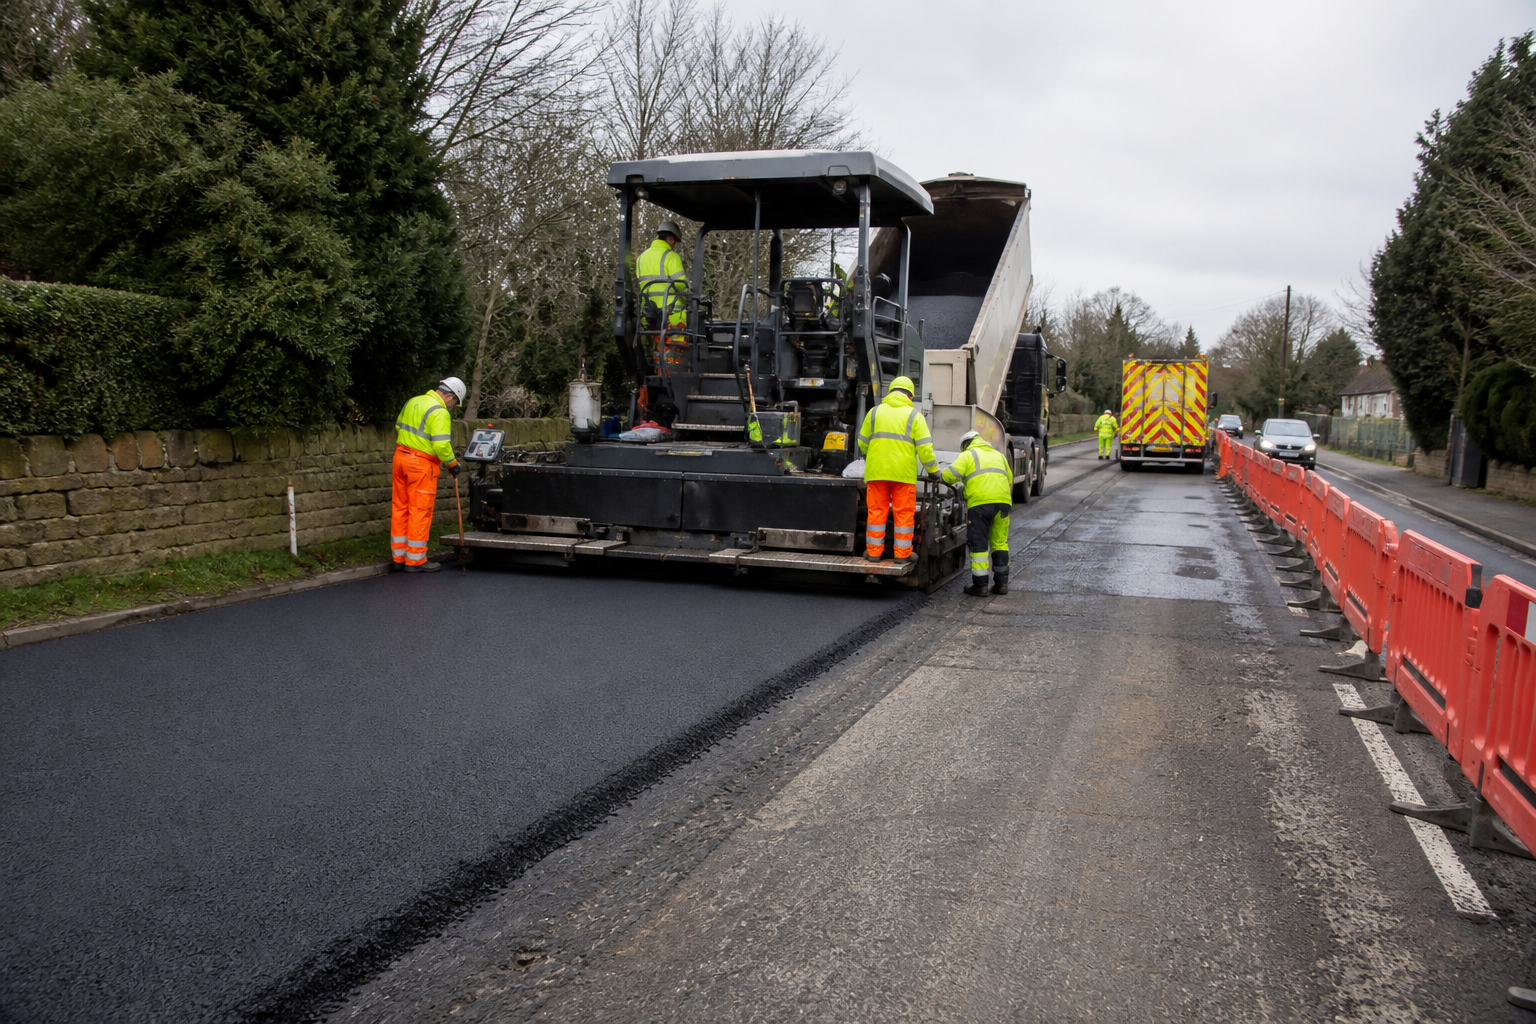
England’s local highway authorities will receive £1.617bn in Department for Transport capital funding for 2026/27, with allocations varying sharply according to road networks, structures and funding arrangements.
The figure is the first annual instalment of a £7.3bn, four-year settlement covering local highway maintenance from 2026/27 to 2029/30. The DfT allocation rises from £1.617bn this year to £2.134bn in 2029/30.
Largest allocations
Devon and Torbay Combined Authority has the largest allocation listed against a single authority, at £89.415m. Greater Lincolnshire Combined Authority follows with £76.001m, ahead of York and North Yorkshire Combined Authority at £64.302m.
Among individual councils, Norfolk receives the largest allocation at £57.999m, followed by Kent at £56.232m and Hampshire at £54.748m. The Isles of Scilly receives £57,000, while Sheffield and Birmingham do not appear as individual recipients because their roads are maintained through private finance initiative contracts.
The published table ranks 95 individual recipients, including county and unitary councils, London boroughs, Transport for London and strategic authorities. A further nine strategic authorities are shown separately for incentive funding only because their baseline allocations sit within wider regional transport settlements.
Funding per mile
The allocation is not ring-fenced for resurfacing. Councils can use the capital funding for carriageways, footways, bridges, drainage and lighting, rather than for routine activities such as inspections or gritting.
Brighton and Hove has the highest allocation per mile among authorities receiving baseline funding, at £14,561. Milton Keynes follows at £13,377, ahead of Cheshire East at £12,878 and Westmorland and Furness at £12,730.
Outside London, the lowest figures among baseline-funded authorities are recorded by Plymouth at £8,958 per mile, Stoke-on-Trent at £9,015, Southampton at £9,153, Essex at £9,321 and Norfolk at £9,514.
The DfT’s formula divides funding between A roads, B and C roads, unclassified roads, bridges and lighting columns. It weights A roads by lanes and uses road-length data from 2022. The source analysis says this means allocations per mile reflect network characteristics rather than a direct assessment of road condition.
London sees sharpest increases
Most authorities outside London receive between 3.3% and 4.0% more than in 2025/26. London boroughs record much larger percentage increases because they qualify for baseline funding for the first time.
Tower Hamlets has the largest increase, at 301.8%, followed by the City of London at 295.7% and Enfield at 214.3%. The increases are measured against the previous year’s full allocation and assume incentive requirements were met.
The DfT says at least 25% of annual incentive funding depends on councils publishing a transparency report. It says the entire incentive allocation will be withheld if a report is not published.
Councils add substantially to government funding
Council transparency reports show that the DfT grant is only part of planned highways maintenance spending. Essex County Council projects total highways maintenance expenditure of £144.811m in 2026/27, including £54.021m reported from UK government sources. Kent plans £137.486m and Hertfordshire £126.296m.
Essex plans to spend £76.011m on carriageways and reports 57.1km of planned resurfacing. Hertfordshire has budgeted £65.142m for carriageways and plans 106km of resurfacing or reconstruction, while Lincolnshire plans about 115km of carriageway resurfacing.
The reports use different definitions and measures for planned work. Some refer to resurfacing, others to structural maintenance, reconstruction, sites or treatment areas, so the figures are not directly comparable.
Preventative work remains a priority
Several councils say they are prioritising preventative treatments over reactive pothole repairs. West Sussex County Council says its strategy “promotes a preventative maintenance approach”, while Dorset Council says 51% of its 2026/27 carriageway activity will be preventative and proactive to “address carriageway deterioration earlier”.
Plymouth City Council says it continues “to increase investment in preventative maintenance to reduce pothole formation”. Stoke-on-Trent projects £3.462m of capital spending on preventative carriageway treatments and £5.6m on structural carriageway maintenance, compared with £266,000 of revenue funding for reactive patching.
Published council examples also show a significant difference between treatment types. Cumberland’s programme puts resurfacing on 2.4km of its non-resilient network at £727,098, while preventative treatments cover 37.1km for £1.541m. These figures equate to approximately £490,000 per mile for resurfacing and £67,000 per mile for preventative treatments, although costs vary with road width, treatment depth and traffic management.
The Asphalt Industry Alliance’s ALARM Survey 2026 estimates the backlog of carriageway repairs in England and Wales at £18.62bn. It also reports that 16% of local roads have less than five years of structural life remaining.